SigNoz Features
Signoz - Does signoz have a permanent tagline?
- SigNoz - APM native to Kubernetes
- SigNoz - Open source observability platform
- SigNoz - Open-source APM to monitor applications & troubleshoot problems
Data
These are the list of features I could find over the entire intenet, every youtube video that has signoz associated with it. I might be wrong but this work needs criticism.
Features that you can't miss!
- Zero Instrumentation
- Based on trusted technologies like Prometheus & Grafana
- Out-of-the-box application metrics
- Competitively priced
- Best in class customer support
- Metrics + Traces in a single pane
- Powerful trace filtering and aggregation capabilities
- Out-of-box like SaaS solutions, requiring minimal dev effort
- Scalable stream processing architecture (Kafka + Druid)
- Can be run within your own cloud
- Flexible and scalable Database storage
- Application overview metrics like requests per second, latency and error rates
- Slowest endpoints in your application
- See exact request trace to figure out issues in downstream services, slow DB queries, call to 3rd party services like payment gateways, etc.
- Filter traces by service name, operation, latency, error, tags/annotations
- Aggregate metrics on filtered traces. Eg, you can get error rate and 99th percentile latency of customer_type: gold or deployment_version: v2 or external_call: Paypal
- Customized dashboard for infrastructure monitoring
- Alert setting on metrics
- Unified UI for metrics and traces. No need to switch from Prometheus to Jaeger to debug issues
...other features
- Enterprise features like RBAC(Role-Based Access Contro) and SSO (Single Sign-On) (coming soon)
- Open source anomaly detection framework (coming soon)
Native support for Open Telemetry instrumentation
Signoz backend, Web UI, and architecture have been designed from ground up to support the OpenTelemetry standard.
- Represent traces as directed acyclic graphs with distributes tracing
- Support strongly typed span tags and structured logs
- more points...
Multiple storage backends
SigNoz supports Flexible and scalable Database storage capabilities.
- we support Clickhouse version x.x.x for small scale.
- Apache Druid version x.x.x. with Kafka version x.x.x for production and enterprise scalability.
Modern Web UI
SigNoz Web UI is implemented in Javascript using popular open source frameworks like React. Several performance improvements have been released in various to allow the UI to efficiently deal with large volumes of data, and to display traces with tens of thousands of spans (e.g. we tried a trace with 1,000,000 spans).
Need for tools like SigNoz
- CNCF Survey Report [link]
- 95% of respondents use monitoring,
- 95% use logging, and
- 74% use tracing
Numbers speak!
Why open source & self-host in 21st century?
- Flexibility of configuration
- Build business specific modules on top of OSS
- Just pay for compute resources and storage you need
- No vendor lock-in. Native to OpenTelemetry
- Data in your control, better data governance
- Rising privacy laws like GDPR, CCPA, etc
tip
Here at SigNoz, divide and conquer? No. We believe in measure and conquer.
SigNoz DASHBOARD
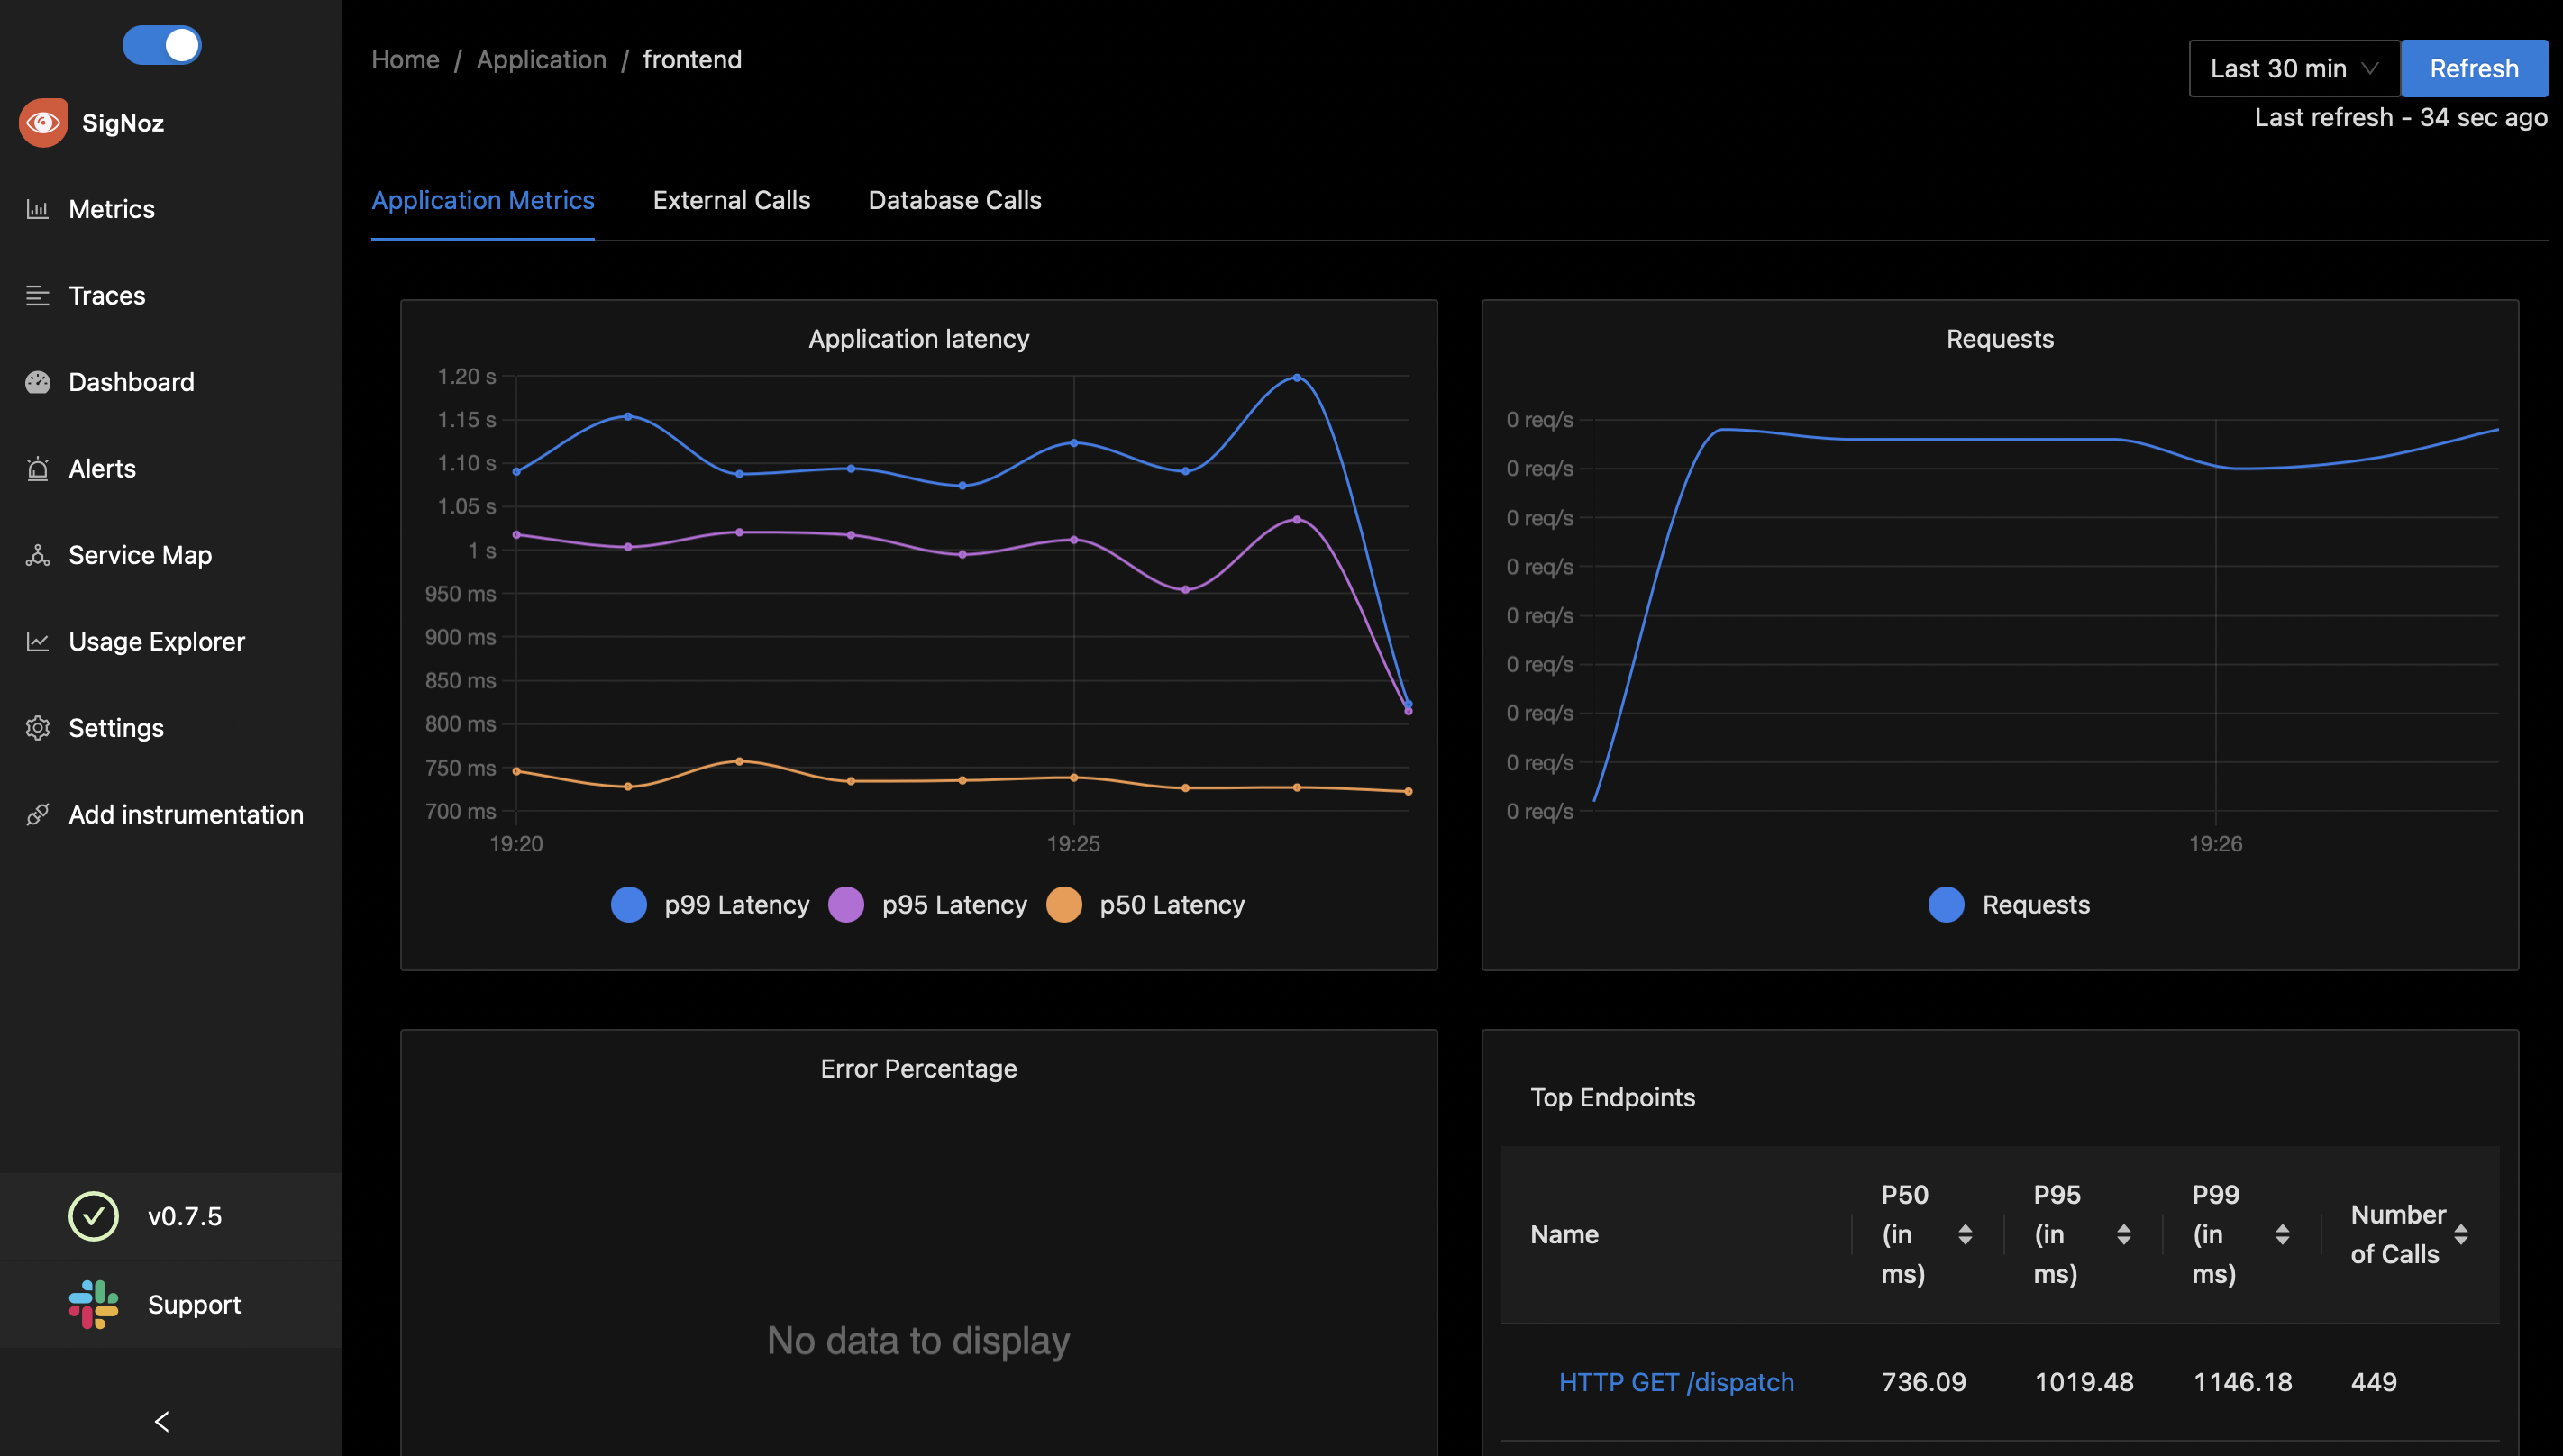
METRICS TAB
Application Metrics:-
- Application Latency (in ms)
- Request Per Second
- Error Percentage (%)
- Top Endpoints
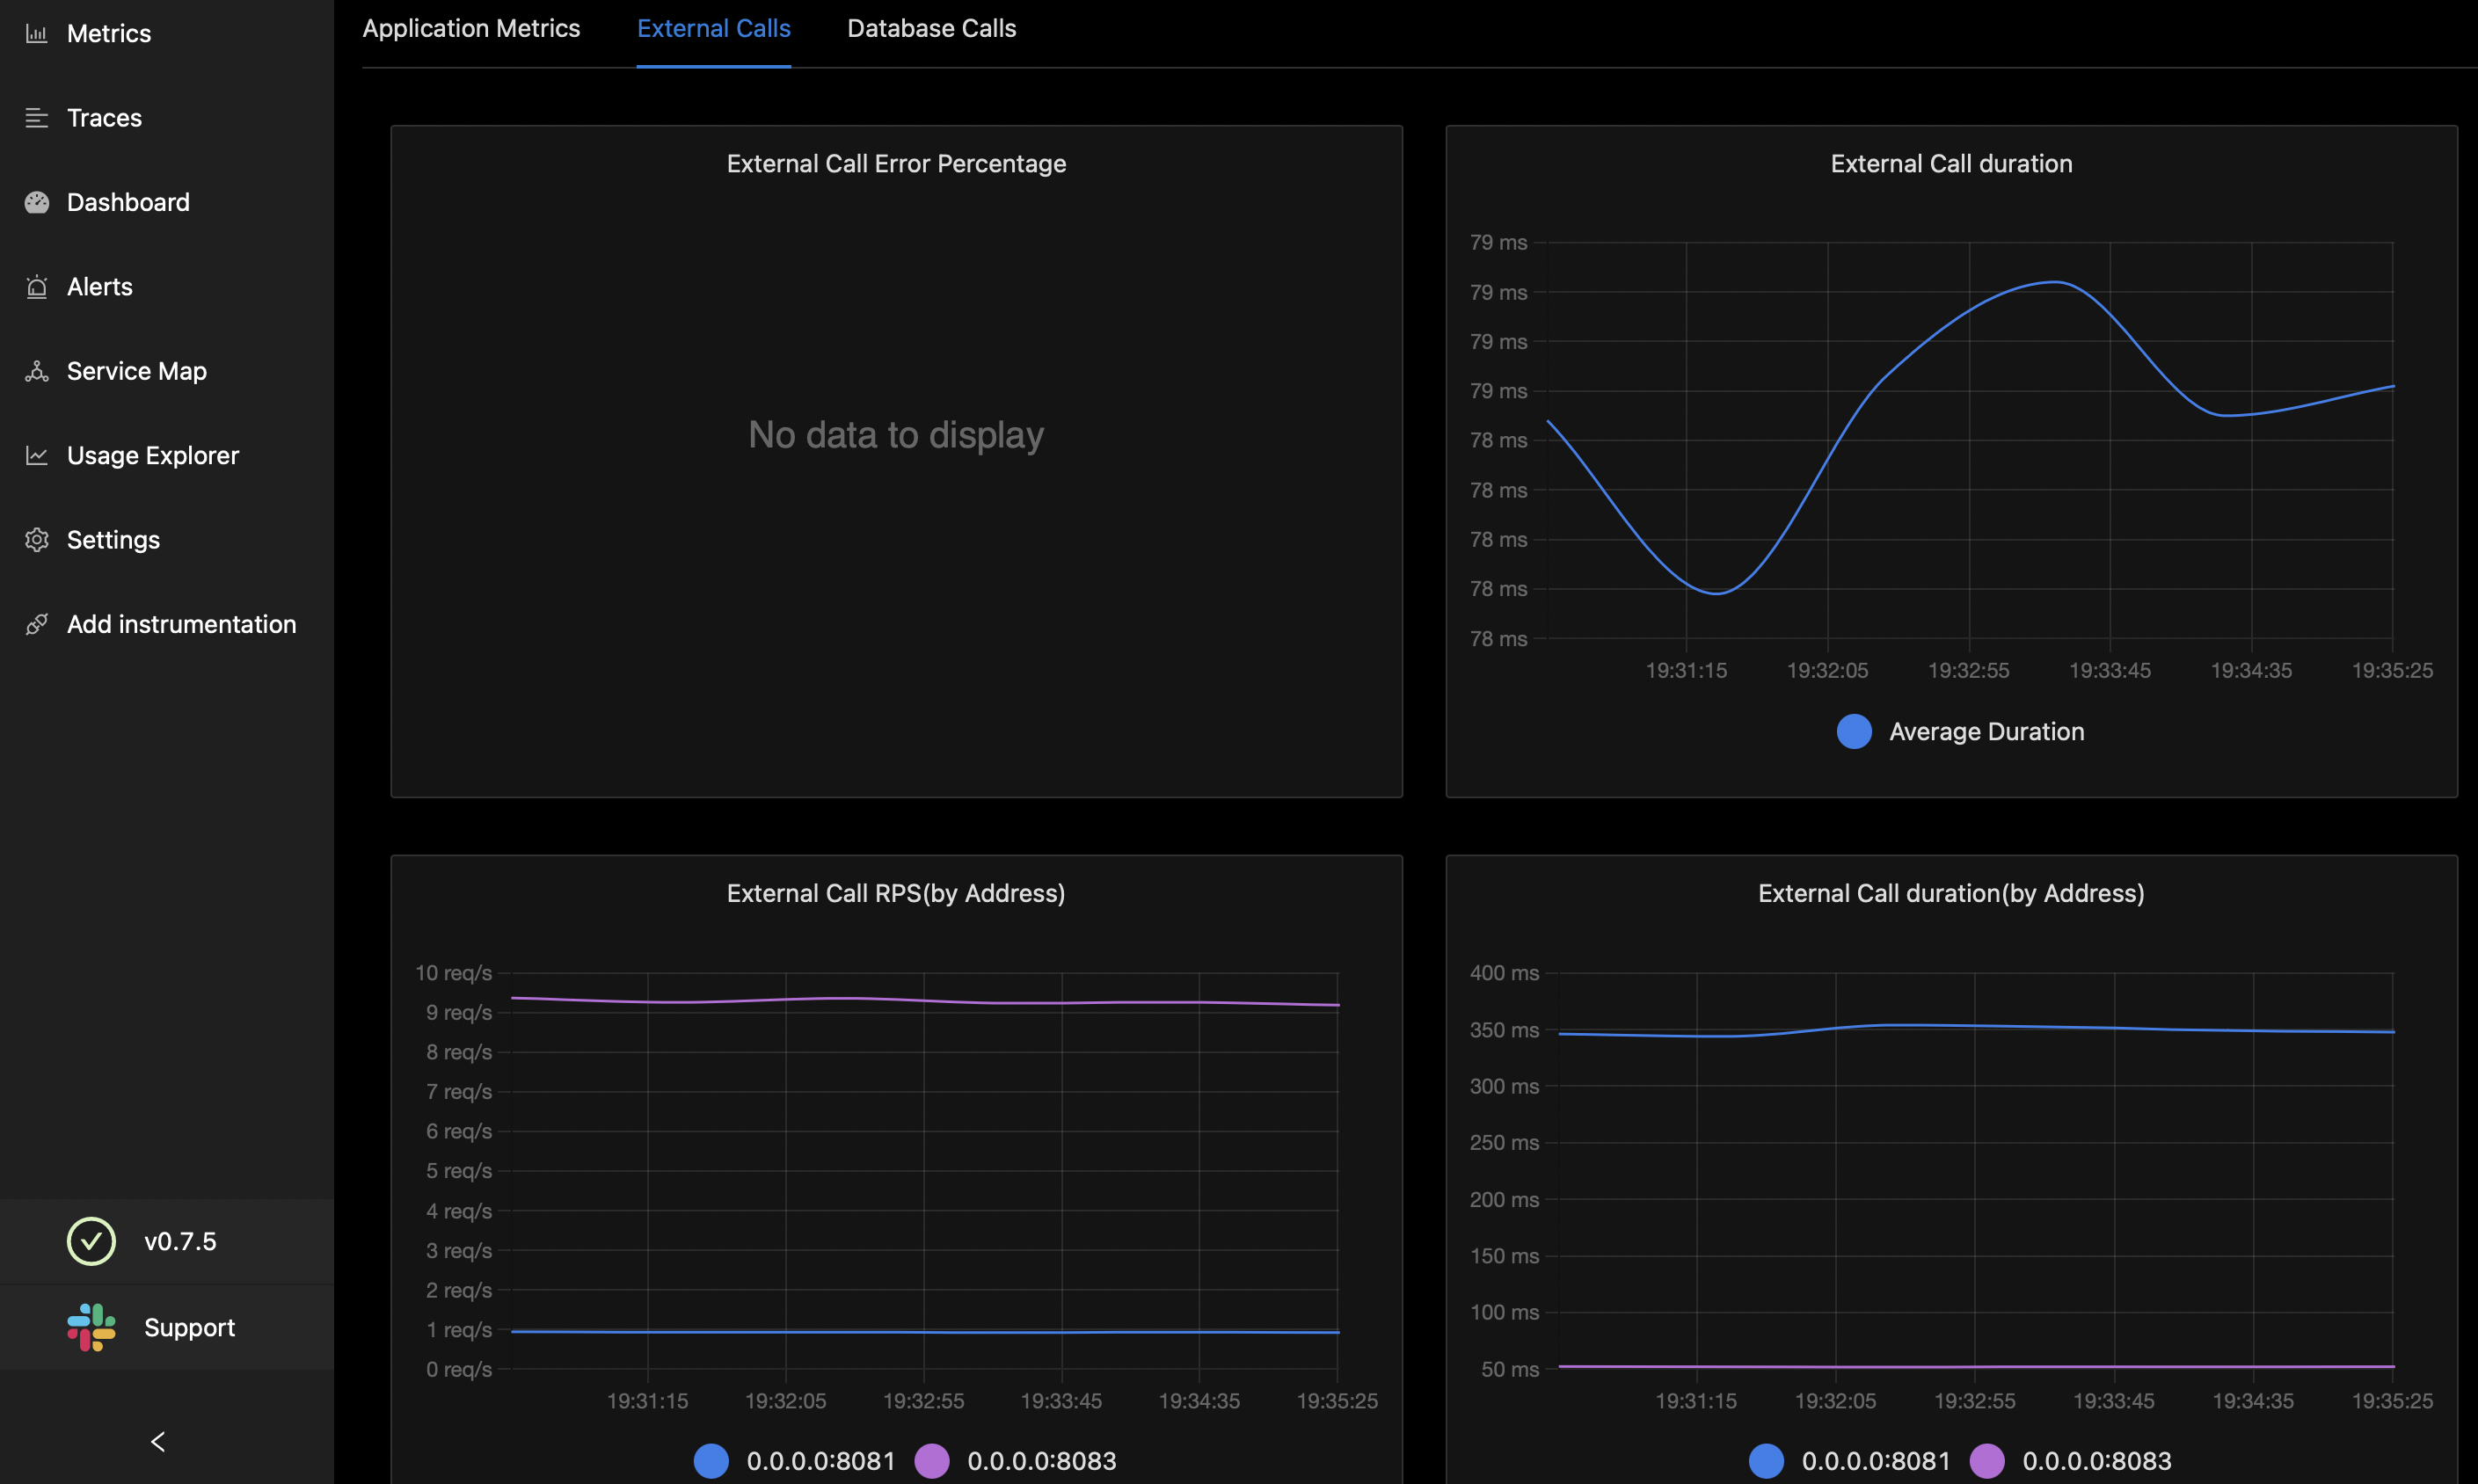
External Calls:-
Our application might be calling other downstream services to get data and sent it back to upstream services. (other IP address calls)
- External Call Error Percentage (%)
- External Call Duration
- External Call RPS (by address)
- External Call Duration (by address)
Database Calls:-
If service is making any database calls to mongoDB, mysql, or other external databases.
- Database Calls RPS
- Database Calls Avg, Duration (in ms)
Clicking on METRICS tab graph and going to traces takes us to traces tab, where we can:
- narrow down to customised latency time, know exact cause of latency
- flame-graphs (of which service calls which service and total time taken to do that call, nested, reset and zoom) and error details are available.
Metrics can sorted according to regex query as well.
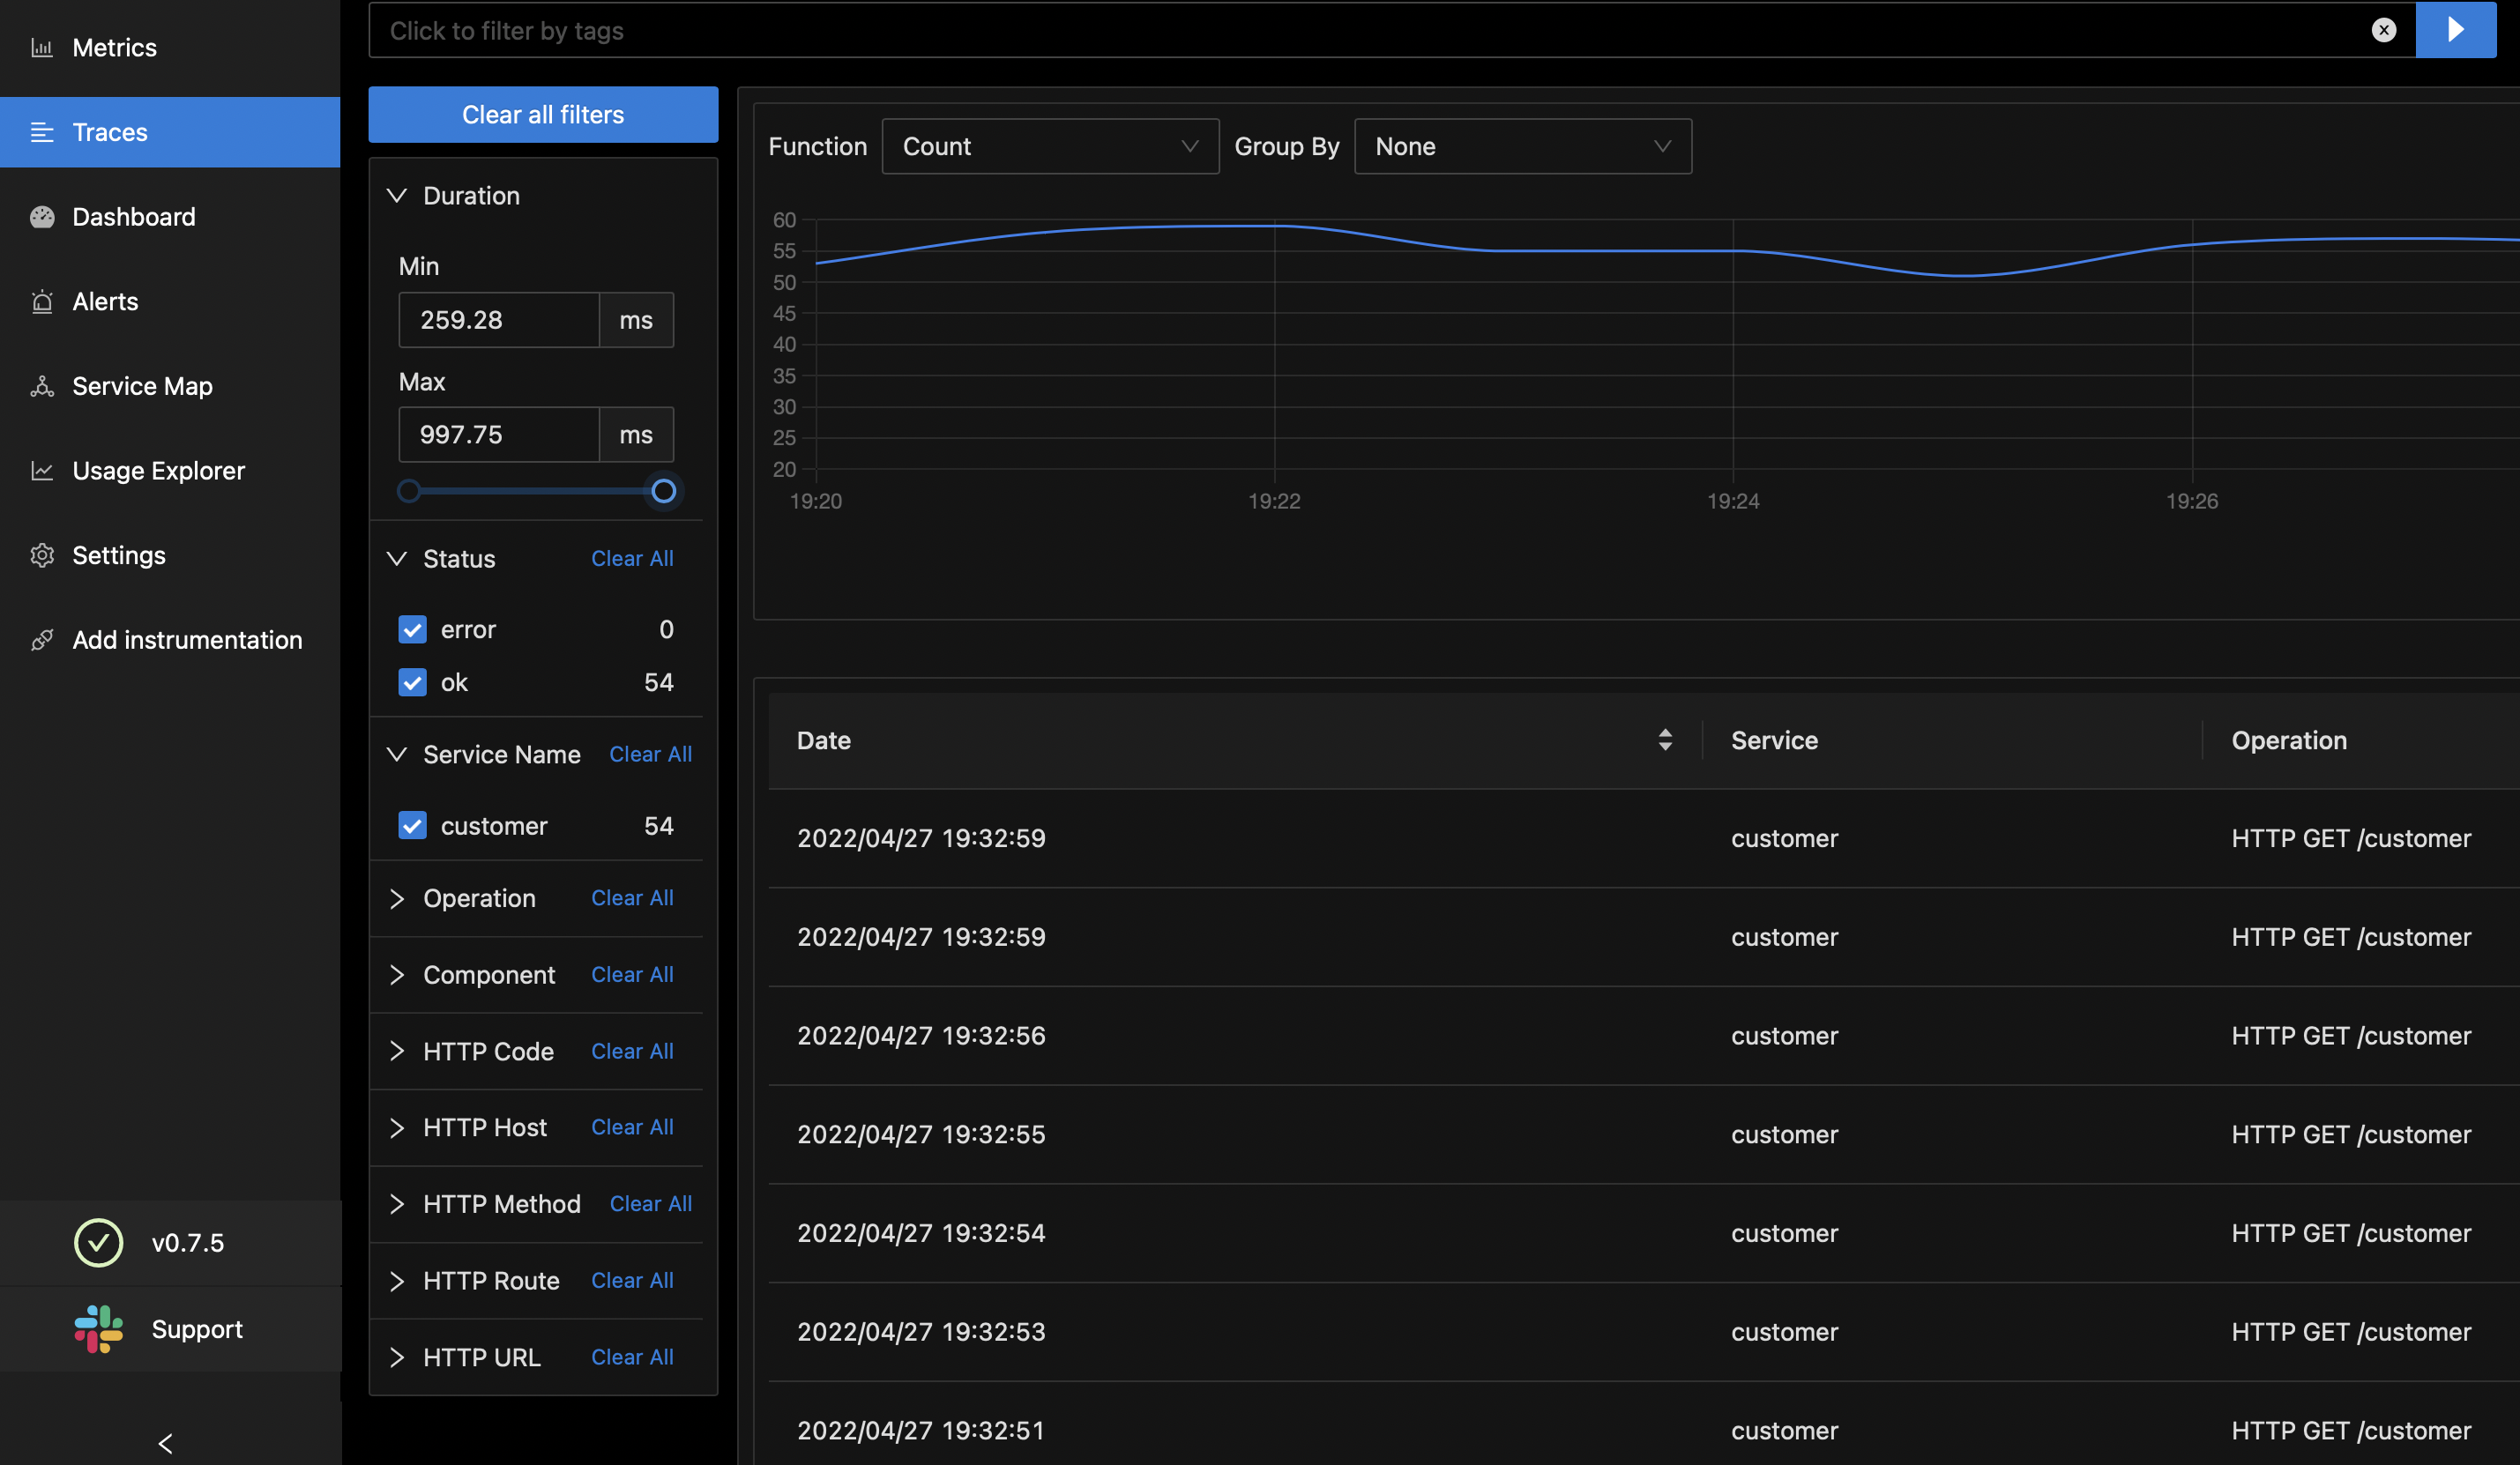
TRACES TAB
Filter traces by:
- A
- B
- C
Select Service to get tag suggestions:
- Tag A
- Tag B
- Tag C
Custom Visualisation:
- Calls/Duration/Error/Status Code
Duration - p50/p90/p99
List of filtered Spans:
- Start Time
- Services
- Operations
- Duration (in ms)
DASHBOARD:
- Name:
- Description
- Tag
- Created By:
- Last Updated Time:
- Action:
New DashBoard [SET NAME, TAG AND DESCRIPTION]
- Time Series
- Value
New Charts under create new Dashboard.
- CPU Visualisation
- Toptal CPU Utilization
- Cluster Memory Usage
- Container Memory Usage
- Total Deployments Desired
- Total Deployments Available
- POD Network I/O
- Cluster Disk Space Used
- CPU Limits Total
- CPU Requests Total
- Network I/O Pressure
- Cluster Filesystem Usage (%)
- Memory Limit Total (GBs)
- Memory Requested Total (GBs)
- PODs in Pending State
- PODs in Running State
- Containers Running by Namespace
- Container Restarts
To make a new chart, we need to fill 2 input values
- Query field
- Legend Format
Example query field looks something like this:
- system_cpu_load_average_1m
- http_request_duration_seconds
- node_memory_usage_bytes
- http_requests_total (for a unit-less accumulating count)
- process_cpu_seconds_total (for an accumulating count with unit)
- foobar_build_info (for a pseudo-metric that provides metadata about the running binary)
- datapipelinelastrecordprocessed_timestamp_seconds
- prometheus_notifications_total (specific to the Prometheus server)
- process_cpu_seconds_total (exported by many client libraries)
- http_request_duration_seconds (for all HTTP requests)
- api_http_requests_total - differentiate request types: operation="create|update|delete"
- api_request_duration_seconds - differentiate request stages: stage="extract|transform|load"
- http_responses_500_total
- http_responses_404_total
ALERTS TAB
- Create Alerts
- set Alert Rules
- View Triggeered Alerts
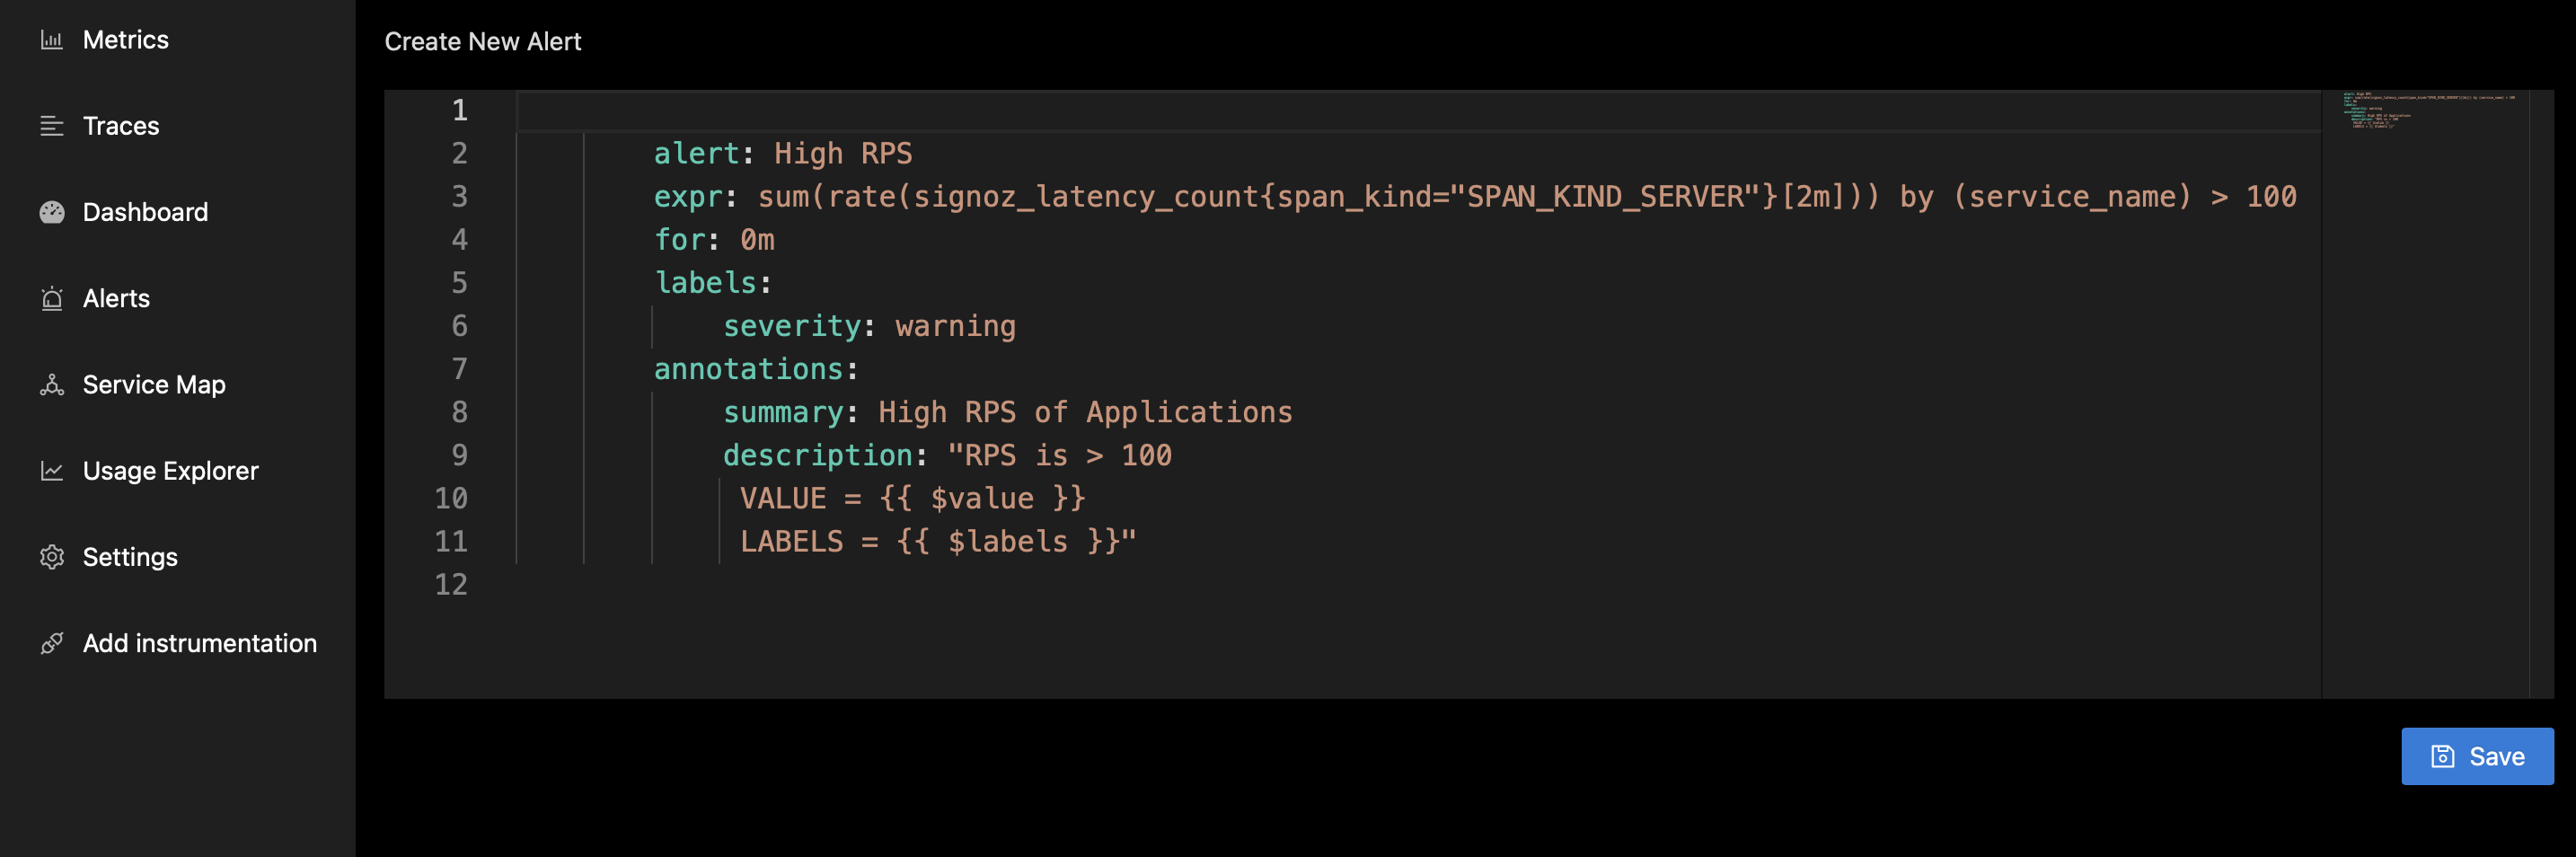
Here is the sample alert code that you might want to use to get started. For more details on alert system, refer Alert Section in the documentation.
groups:
- name: ExampleCPULoadGroup
  rules:
  - alert: HighCpuLoad
    expr: system_cpu_load_average_1m > 0.1
    for: 0m
    labels:
      severity: warning
    annotations:
      summary: High CPU load
      description: "CPU load is > 0.1\n  VALUE = {{ $value }}\n  LABELS = {{ $labels }}"
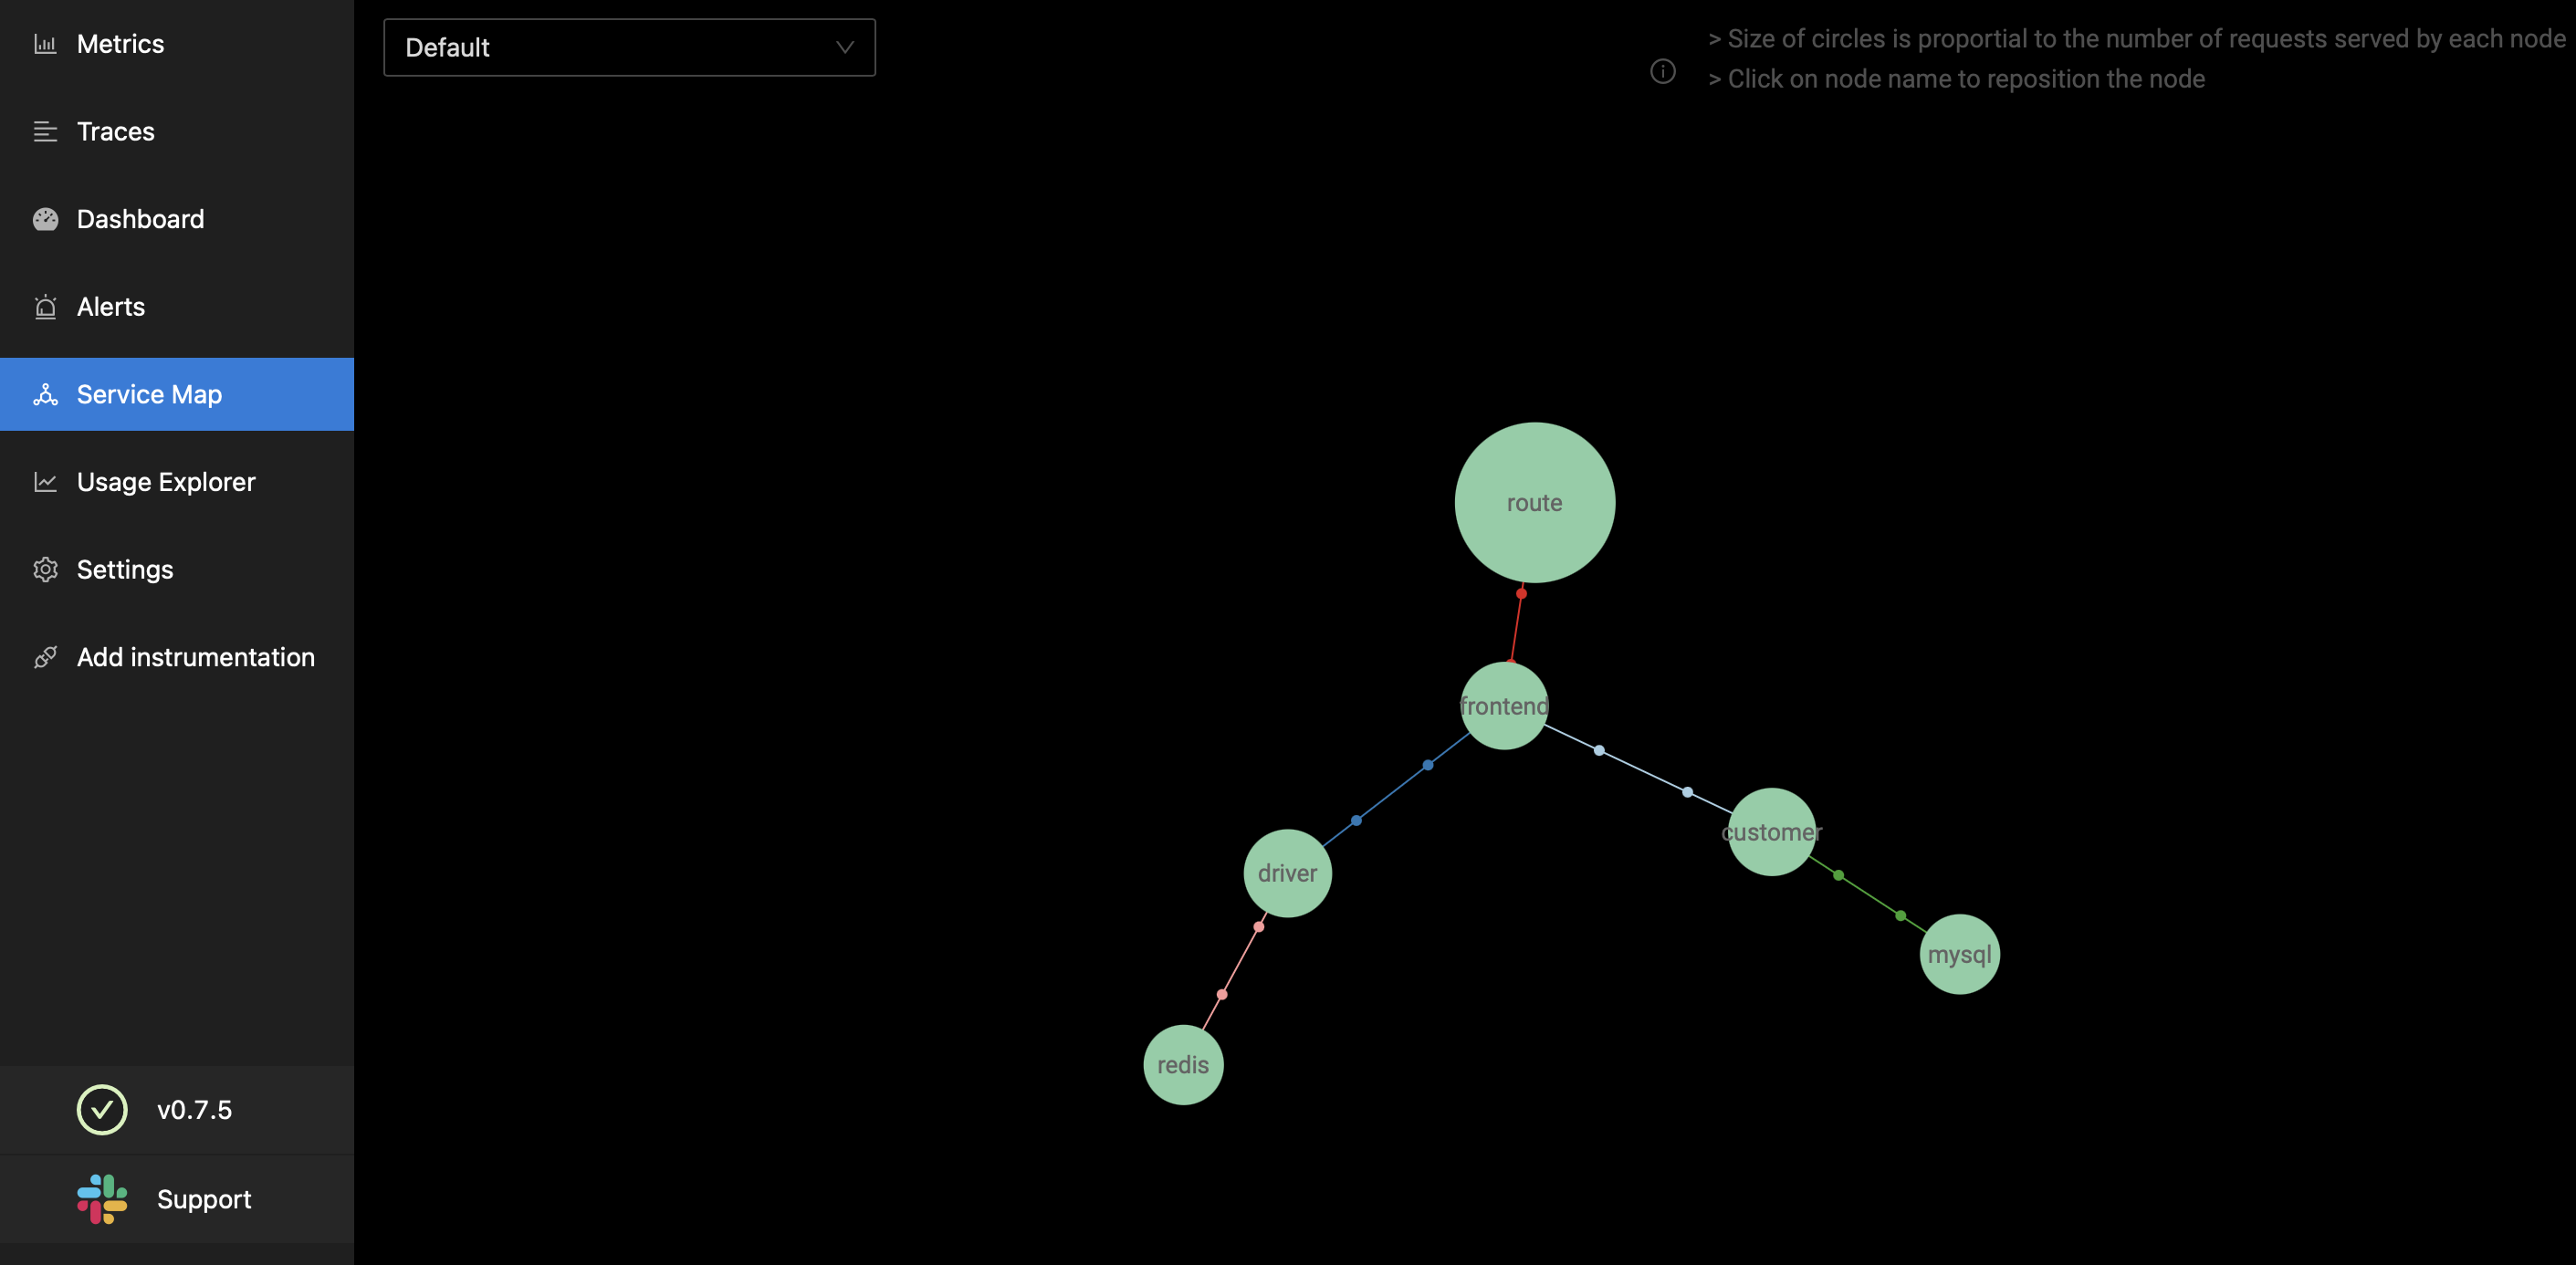
SERVICE MAPS TAB
- List of all services here, like service A talking to service B, all plotted out here.
- Health of the service, with colouring (Green, Red), slow, fast, etc.
- Size of circle denoted how many request it is serving.
in other words,
- SIZE OF CIRCLE in health map is equal to number of requests for each node. [mention what all data you can view in service maps for each node]
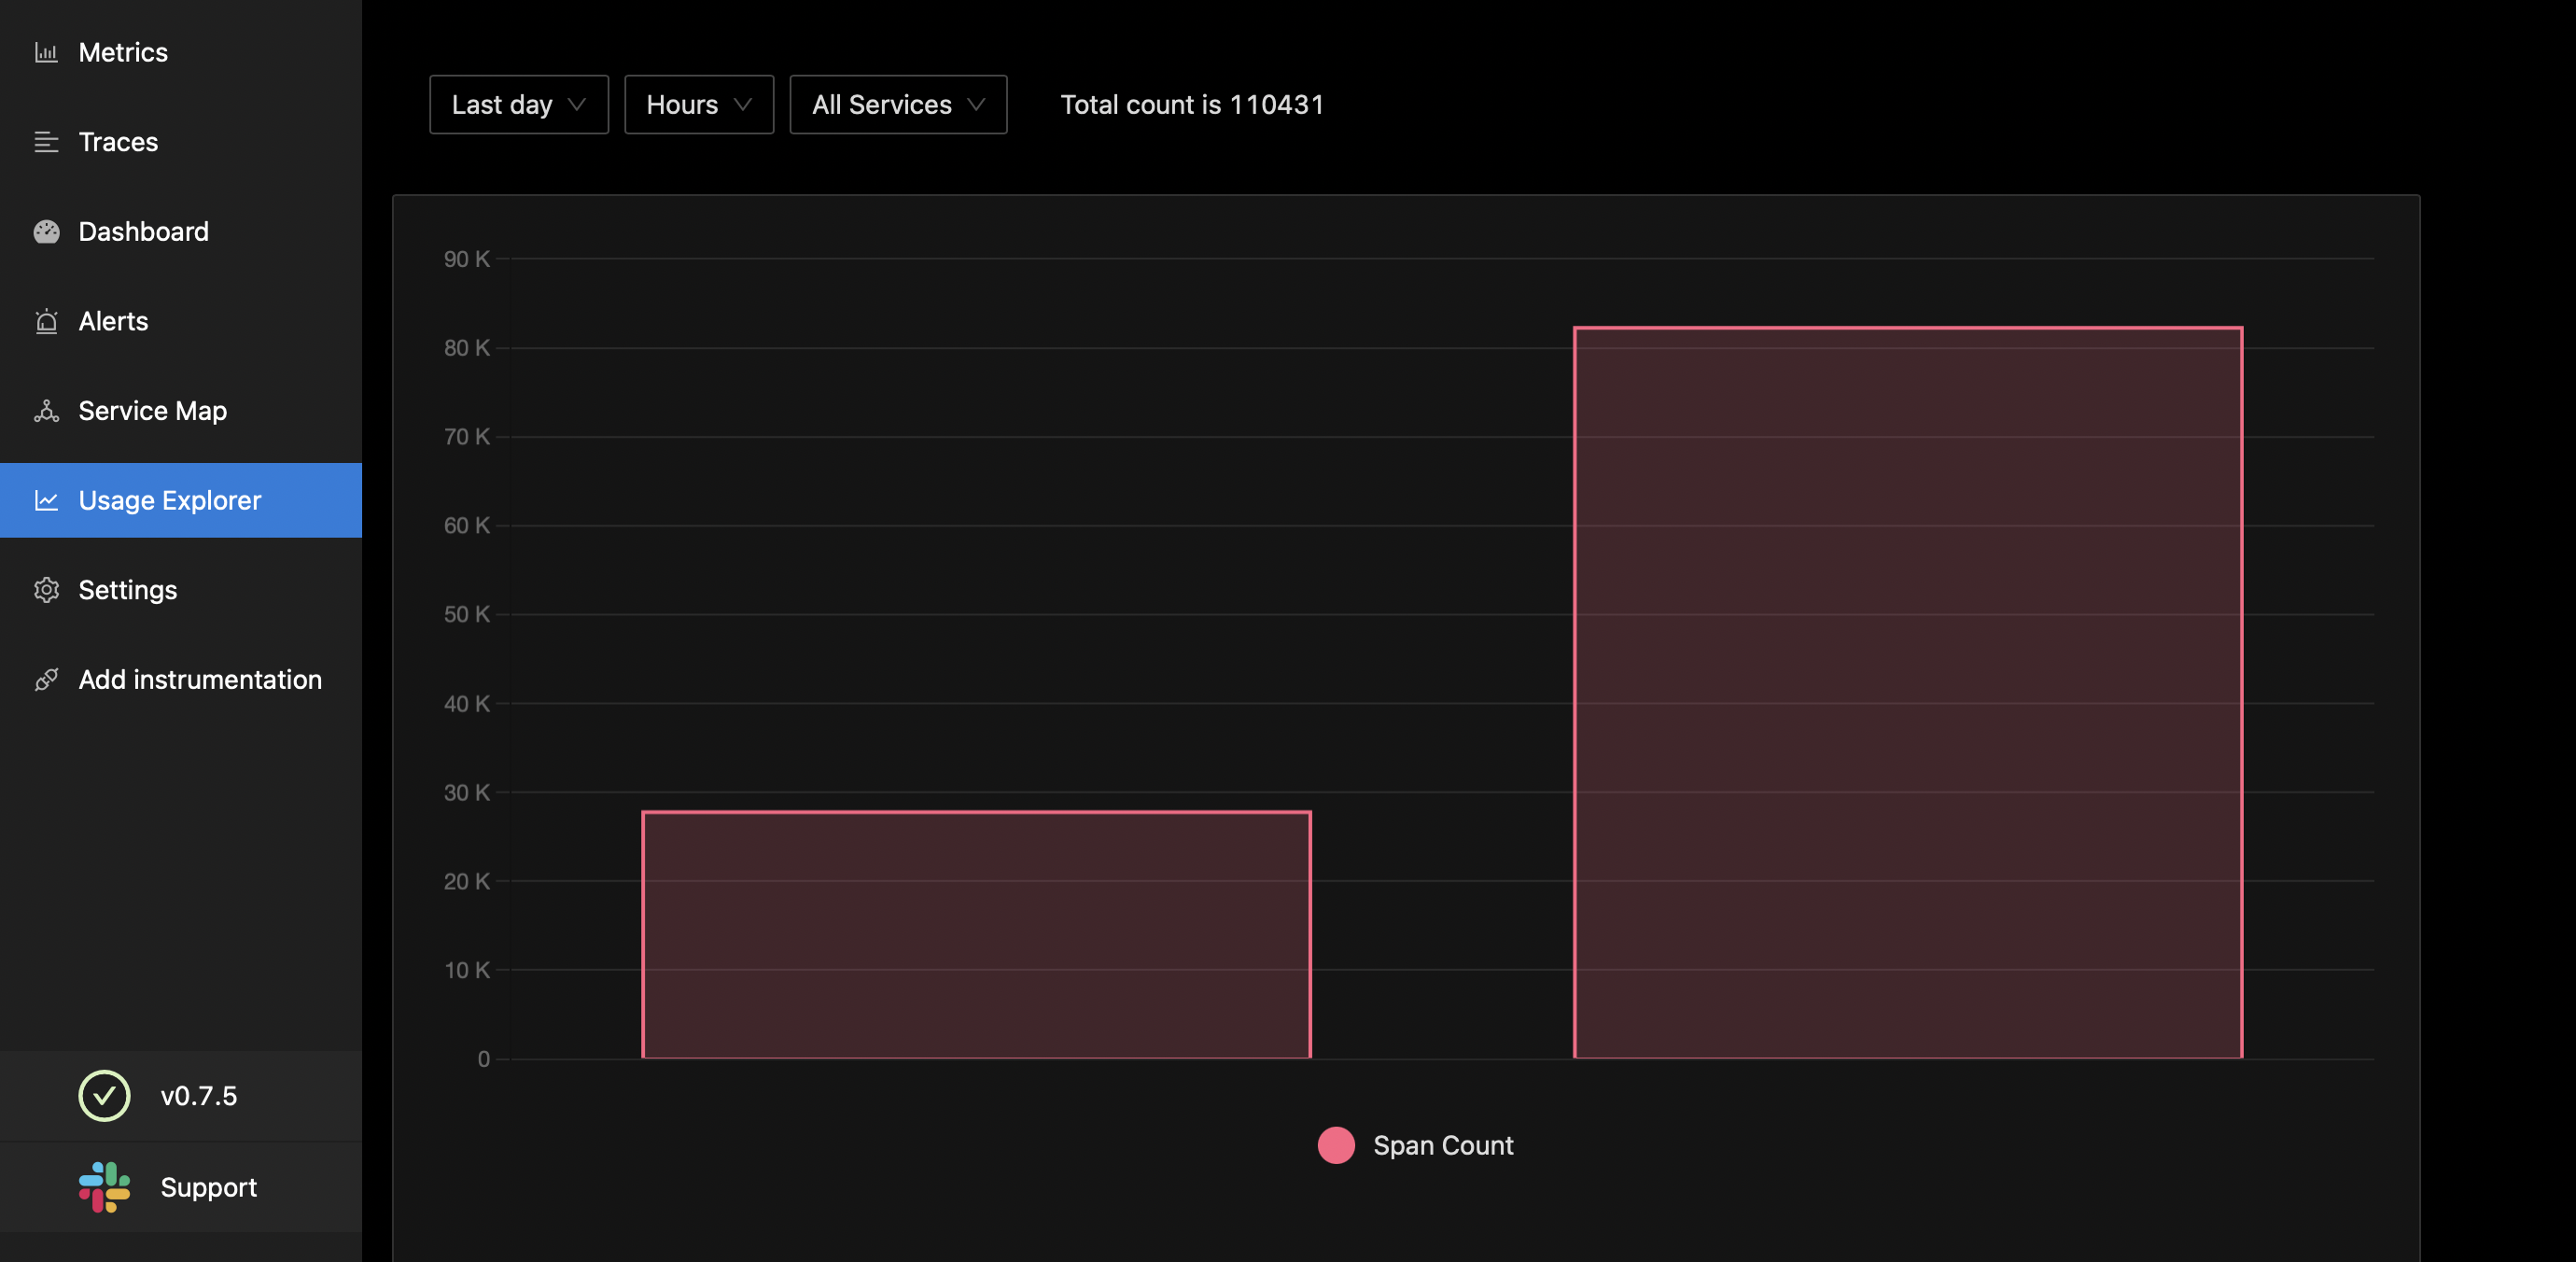
USAGE EXPLORER TAB
- Figure out how much data are you crunching or receiving or sending to SigNoz backend. (daily, weekly, hourly, filter by services)
- Number of events count.
- Sort according to timestamp.
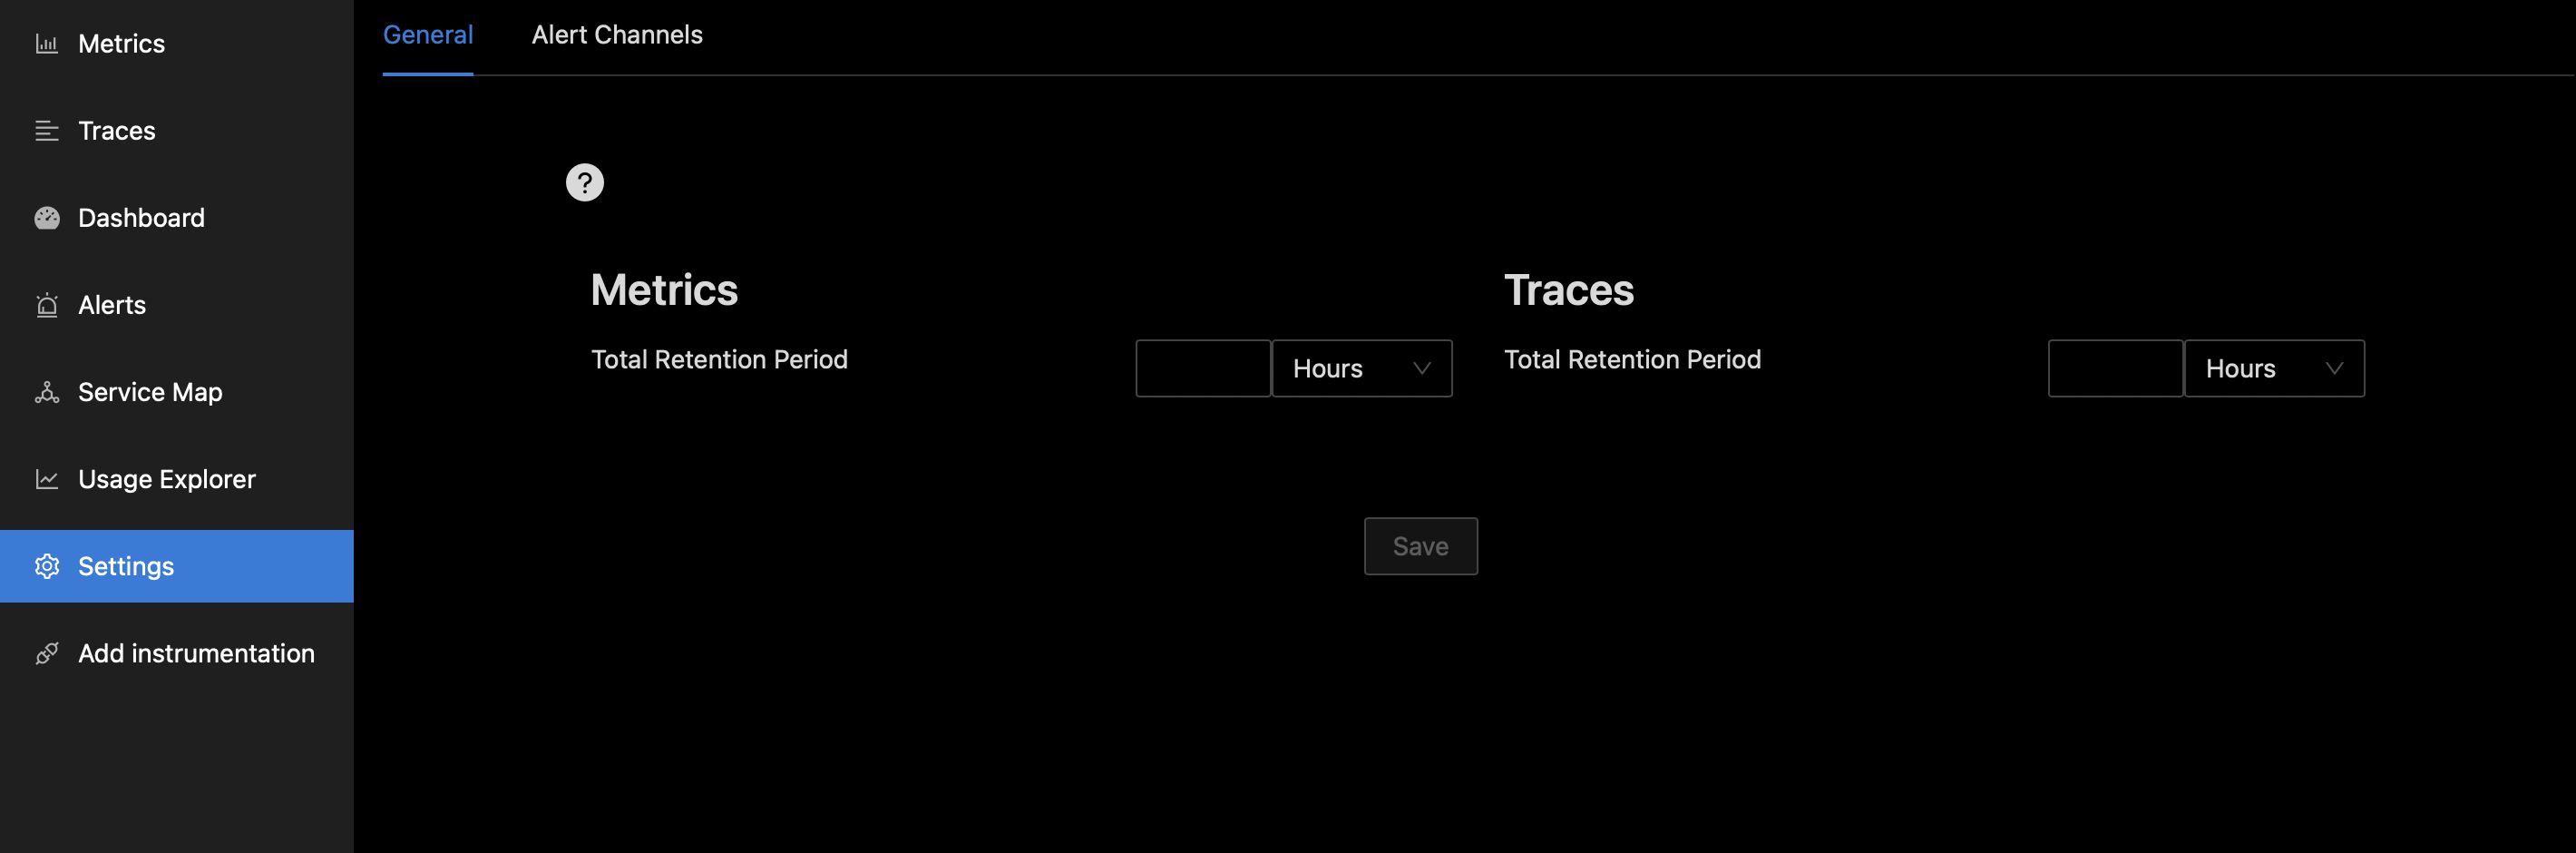
SETTINGS TAB
Retention period of data (3 days by default). S3 is cheapest cold storage DB.